

With five months of 2024 behind us and approximately five months until the presidential election, let’s check in on the stock market’s performance during this election year.
Being an election year, election year market theories have garnered attention. The “Presidential Election Cycle Theory” was initially put forth by Yale Hirsch, the Stock Trader’s Almanac creator. It was furthered by Pepperdine professor Marshall Nickles in a paper called “Presidential Elections and Stock Market Cycles1.” The president’s third year is usually the strongest year for the market, followed by year four, then the second, and finally the first. Though there are general tendencies, wide variances leave investors without clear direction.
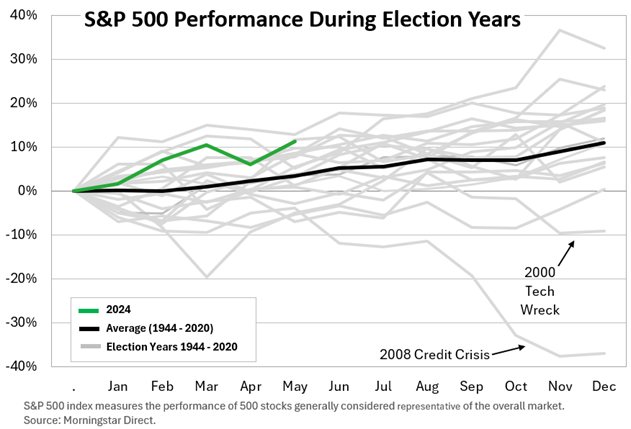
We reviewed election year stock market performance since 1944, or the past 20 election year cycles. The average return for these election years was 10.9%2. Only two election years (2000 and 2008) experienced negative returns2. Further analysis of 2000 and 2008 indicates the market dynamics and the economic environment gave investors pause. Both periods accompanied recessionary pressures and high stock valuations that transcended the political environment.
So far, 2024 has trended above the historic average. 2024 started off with a bang in the first quarter followed by a pullback in April and a recovery in May. International stocks (represented by the MSCI EAFE Index) have delivered similar returns, while smaller US companies (represented by the Russell 2000 Index) have struggled to get out of low single digit returns.
Tea leaf reading market watchers are probably confused. Interestingly, President Biden’s stock market performance has not conformed to the Presidential Election Cycle Theory. President Biden’s best year, so far, has been his first (2021), followed by his third (2023), with his second (2022) likely to be his worst. This differs significantly from the average 3-4-2-1 presidential year ranking suggested by the Presidential Election Cycle Theory. For Trump’s administration, the ranking was 3-1-4-2. For Obama’s first term, the ranking was 1-4-2-3, while Obama’s second term was 1-2-4-3.
So, what does this mean? Market participants are constantly combing through data to find inefficiencies or discrepancies that can be exploited. Searching for data to create a simple screen seems easier than conducting bona fide time-consuming company, credit, and economic analysis. This is also a warning to the legions of traders looking to make a quick buck in the financial markets: as soon as you find an inefficiency, so will others evaporate said inefficiency. Setting up a stock screen and retiring to the beach for a Mai Tai is only valid in commercials and movies. The real world is much more complicated. With that said, please enjoy a Mai Tai or your beverage of choice this weekend.
2 Morningstar
CRN-6669379-060424
Recent Comments